Power Business Intelligence Tools
Tools to Transform, Analyse & Visualise Data
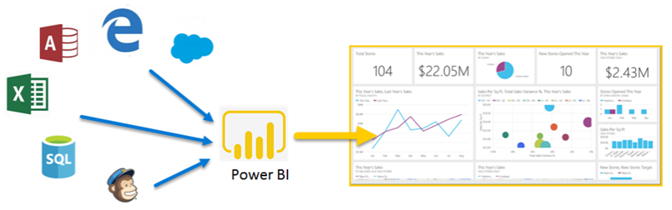
Power BI transforms your Company’s data into rich visuals so you can focus on what matters to you
Power BI Seminar
Learn more about Power BI in a 2 hour seminar – 3 sessions per day
Seminar Overview
- Overview of Power BI
- Features of Power BI Desktop
- Demo: Connecting to A Data Source
- Demo: Transform a Data Source
- Demo: Create & Format Clustered Column Visual
- Demo: Using Dax Function
- Features of Power BI Service
- Demo: Quick Insights
- Demo: Pin Visual Tile to a Dashboard
- Q & A Session
Now available through our Virtual Classroom – contact our Sales Team for more information!
Your whole business on one dashboard
- Live dashboards provide a 360 degree view of your business
- Important metrics in one place
- Explore the data behind the dashboard using intuitive tools
- Pre-build dashboards to get you up and running quickly
Consistent data analysis
- Build robust, reusable models over your data to provide consistency across reporting and analysis in your organisation
- Power BI lets you be productive and creative
Power BI Desktop
- Combine data from databases, file and web services
- Visualise and analyse everything in one
The tools …..
- Microsoft Power BI Desktop
- Microsoft PowerPivot
- Microsoft PowerMap
- Microsoft PowerView
Excel Power BI Tools – Part 1
Target Audience
This course is suitable for users who are not familiar with the Power BI Tools and wish to gain an understanding of the features and advantages of the tools available and for users looking to add value to the data they are currently manipulating.
This two-part course gives an introduction into the Power BI tools when analysing data from databases, Excel worksheets and other sources together in one PowerPivot. It includes using ‘Dashboards’ to build interactive applications to review the data at the click of a button. In addition to the graphical tools, PowerPivot includes Data Analysis Expressions (DAX) – a new formula language that extends the data manipulation capabilities of Excel – this course gives an introduction to enabling more sophisticated and complex grouping, calculation and analysis with performance enhancements.
The Content
PowerPivot – What is it?
- Working within Pivot Tables in PowerPivot
- Power BI in Excel
- Power Bi – The bigger picture
- Enabling PowerPivot
What is a relationship?
- Columns & Keys
- Types of relationships
- Relationships and Performance
- Requirements for Relationships
- Unique identifier for each Table
- Automatic detection & inference of Relationships
- Automatic detection for named sets
Adding Data to PowerPivot Workbook
- Adding data by using the Table Import Wizard
- Creating a connection to an Access database
- Filtering the data table prior to importing
- Add Data by using Custom Query
- Using Copy & Paste
- Using an Excel Linked Table
Create Relationships between Tables
- Why create relationships?
Using Diagram View
- Navigating Diagram View
- Tables in Diagram View
- To create a hierarchy in a Table
- Maximise a Table’s size
- Review existing relationships
- Create new relationships between data from separate sources
- Create relationships in Diagram View
Create a Calculated Column
- Understanding calculation in DAX
- Using the RELATED DAX function
Create a Hierarchy in a Table
- Why create hierarchies?
- Creating hierarchies
- Editing hierarchies
- Change name of a hierarchy or child node
- Deleting a hierarchy and removing child nodes
Create PivotTable from PowerPivot Data
- Adding a Pivot Table to your analysis
Create a PivotChart from PowerPivot
- Adding a PivotChart to your analysis
- Creating a Flattened Pivot Table to analyse combinations of unique data
Adding Slicers to Pivot Tables
- Adding Slicers
- Formatting Slicers
Creating a Measure and KPI
- Measures
- KPI’s
Adding a PowerView Perspective of the Data
- Adding a PowerView visualisation
Delegate Pre-Requisites
Aimed at delegates with a high level of experience using Excel and Pivot Tables combined with an understanding of relational data bases
Course Duration
This is a One Day Course
Course Details
Courses commence at 9:30 a.m. through to 4:30 p.m.
A laptop computer is provided for each delegate attending on this packed programme to try out the tips and techniques demonstrated
All delegates will receive comprehensive Training Courseware to refer to during the course, together with a Course Attendance Certificate
The Content
Review of PowerPivot and PowerView
Introducing PowerQuery
- Understanding where Power Query fits in with the rest of the Power BI stack
- Extracting data with Power Query – relational databases; text files; OData feeds and more ..
- Creating Power Query transformations in the user interface
- Loading data to Excel tables & Excel Data Model/PowerPivot
- Writing expressions and queries in M
- Working with multiple queries & data privacy settings
Adding value to internal data with external data sources
Analysing Data with PowerMap
Publishing PowerMap to PowerPoint
Data Mining with Excel
Leveraging PowerPivot, PowerView, PowerQuery and PowerMap
Delegate Pre-Requisites
Delegates should have attended the Excel Power BI Tools – Part 1 course
Course Duration
This is a One Day Course
Course Details
Courses commence at 9:30 a.m. through to 4:30 p.m.
A laptop computer is provided for each delegate attending on this packed programme to try out the tips and techniques demonstrated
All delegates will receive comprehensive Training Courseware to refer to during the course, together with a Course Attendance Certificate
Excel Power BI Tools – Using PowerPivot
Target Audience
PowerPivot for Excel allows you to query and analyse millions of rows of data quickly and easily. Analysing data from databases, Excel worksheets and other sources together in one PowerPivot and using ‘Dashboards’ to build interactive applications to review the data at the click of a button.
In addition to the graphical tools, PowerPivot includes Data Analysis Expressions (DAX) – a new formula language that extends the data manipulation capabilities of Excel to enable more sophisticated and complex grouping, calculation and analysis with performance enhancements.
An introduction into adding a PowerView perspective to easily add dynamic & meaningful graphics to data is also included in the day.
This content rich, intense course allows you to learn about the PowerPivots tools – see our website for additional courses on using the Power BI tools
The Content
PowerPivot – What is it?
- Working with classic Pivot Tables
- Working within Pivot Tables in PowerPivot
- Power BI in Excel
- Power Bi – The bigger picture
- Enabling PowerPivot
What is a relationship?
- Columns & Keys
- Types of relationships
- Relationships and Performance
- Requirements for Relationships
- Unique identifier for each Table
- Automatic detection & inference of Relationships
- Automatic detection for named sets
Adding Data to PowerPivot Workbook
- Adding data by using the Table Import Wizard
- Creating a connection to an Access database
- Filtering the data table prior to importing
- Add Data by using Custom Query
- Using Copy & Paste
- Using an Excel Linked Table
Create Relationships between Tables
- Why create relationships?
Using Diagram View
- Navigating Diagram View
- Tables in Diagram View
- To create a hierarchy in a Table
- Maximise a Table’s size
- Review existing relationships
- Create new relationships between data from separate sources
- Create relationships in Diagram View
Create a Calculated Column
- Understanding calculation in DAX
- Using the RELATED DAX function
Create a Hierarchy in a Table
- Why create hierarchies?
- Creating hierarchies
- Editing hierarchies
- Change name of a hierarchy or child node
- Deleting a hierarchy and removing child nodes
Create PivotTable from PowerPivot Data
- Adding a Pivot Table to your analysis
Create a PivotChart from PowerPivot
- Adding a PivotChart to your analysis
- Creating a Flattened Pivot Table to analyse combinations of unique data
Adding Slicers to Pivot Tables
- Adding Slicers
- Formatting Slicers
Creating a Measure and KPI
- Measures
- KPI’s
Adding a PowerView Perspective of the Data
- Adding a PowerView visualisation
Delegate Pre-Requisites
Aimed at delegates with a high level of experience using Excel and Pivot Tables combined with an understanding of relational data bases
Course Duration
This is a One Day Course
Course Details
Courses commence at 9:30 a.m. through to 4:30 p.m.
A laptop computer is provided for each delegate attending on this packed programme to try out the tips and techniques demonstrated
All delegates will receive comprehensive Training Courseware to refer to during the course, together with a Course Attendance Certificate
The Excel PowerBI Tools
Data Analysis for Business Intelligence
Target Audience
Aimed at users who need to transform and present data to provide Business Intelligence. This advanced Excel course covers effective manipulation of large data files from multiple sources and uses the BI tools to summarise, aggregate and communicate data using visual dashboards. Shape and filter tables, transform and present data to provide improved business insights and empower informed decision making.
The Content
WHY POWERPIVOT?
- Working within Pivot Tables in PowerPivot
- Power BI in Excel
- Power Bi – The bigger picture
- Enabling PowerPivot
BUILDING THE DATA MODEL
Defining a consolidated view of data
- Generating a data mashup from structured and unstructured data sources into a data model
- Deriving relationships from data sources with the Relationships tool and the Diagram View
Denormalising data to simplify usage within other BI reporting tools
- Acquiring data from related tables
- Defining calculated columns
- Consolidating information available to BI tools
Querying SQL Server data
- Designing queries to import data from SQL Server
- Relating tables with outer joins
Fixing common data issues with Power Query
- Extracting, Transforming and Loading (ETL) data
- Converting data formats with Power Query steps
- Parsing columns to aid analysis
- Removing duplicates from a data set
- Constructing a single data set from multiple sources with the same field headings
MANIPULATING & ANALYSING WITH DATA ANALYSIS EXPRESSIONS (DAX)
Defining measures for business performance
- Distinguishing the role of measures
- Translating key business concepts into measures
- Providing context for measures within a PivotTable
- Determining between implicit and explicit measures
Implementing DAX functions in PowerPivot
- Expressing information with measures
- Exposing hidden information from data
- Troubleshooting and debugging DAX calculations
Exploiting data analytics with aggregation
- Quantifying and mining information with DAX functions
- Summarising and aggregating data from other tables with the X functions
- Evaluating expressions with the CALCULATE() function and filter functions
- Substituting values with the SWITCH() function
Mining for information with date and time analysis
- Grouping dates for time analysis
- Comparing and categorising time periods with Time Intelligence functions
Setting key business targets with KPIs
- Analysing performance with measures
- Gauging performance against goals
DASHBOARDS
Articulating and analysing data
- Drilling down into data using a hierarchy
- Managing data with perspectives
- Identifying patterns and trends in your Power Pivot data with Power View charts
- Classifying data into different geographical regions
Designing effective dashboards
- Contextualising measures with PivotTable slicers and Power View filters
- Documenting structures with Hierarchical Diagrams
- Visualising and comparing performance matrices with Power View multipliers
- Globalising location-based results to identify trends and patterns on a 3D scale with Power Map
CREATING TEAM BI SOLUTIONS
- Defining the requirements for a team solution
- Coordinating results with team members
- Sharing a PowerPivot solution
Delegate Pre-Requisites
Aimed at delegates with a high level of experience using Excel and Pivot Tables combined with an understanding of relational data bases
Course Duration
This is a Two Day Course
Course Details
Courses commence at 9:30 a.m. through to 4:30 p.m.
A laptop computer is provided for each delegate attending on this packed programme to try out the tips and techniques demonstrated
All delegates will receive comprehensive Training Courseware to refer to during the course, together with a Course Attendance Certificate
The Excel Power BI Desktop
Target Audience
Power BI Desktop is part of the suite of tools from Microsoft which enable data to be analysed and published from a variety of sources. Power BI Desktop is a report authoring tool that enables you to connect to and query data from different sources using the Query Editor. From the datasets you build with Query Editor you can create Reports and Visualizations or dashboards within Power BI Desktop. This course covers the use of Power BI Desktop to connect to data, create visualisations, query the data and publish reports. Please note : this does not cover Power BI Pro, Power BI accessed via Office 365 or SharePoint Services.
The Content
Introduction to the Power BI Desktop
- The Power BI Concepts
- Features overview
- Imports
- Visualizations
- Using Filters and Queries
- Reports
Connecting to Data Sources with Power BI Desktop
- Data Sources connected with Power BI Desktop
- Data Types and Properties in Power BI Desktop
- Importing and Entering Data
- Get Data and Query Editor
- Overview of the Query Editor
- Using the Query Editor to Connect to Data
- Combining Data Sources as a Mash Up
- Working with Relationships in Data
Data Visualizations
- Overview of Data Visualizations
- Tables and Matrix Views
- Applying Conditional Formats
- Charts
- Interactive Data and Date Slicers
- Drill Visualizations to see underlying data
- Create Reusable Field Hierarchies
- Record Grouping and Binning in Visualizations
- Drill Visualizations with using Dates
- Clustering
- Analytics and Forecast Lines in Visualizations
- Creating Role Based Views
- Data Categories, Geo-Data and Maps
Querying and Shaping the Data
- Common Activities using Query Editor
- Filters
- Transforms
- Pivot and Group By
- Creating Custom Calculated Columns
- Adding Conditional Columns
- Introduction to DAX Expressions
- Histograms
Reports and Output Options
- Report Elements and Options
- Working with Pages
- Adding Graphics
- Visual and Filter Settings
- Export Power BI Data to CSV
Creating a Power BI Template
Delegate Pre-Requisites
Aimed at delegates with a high level of experience using Excel, Pivot Tables and relational Databases – not suitable for new Excel or database users.
Course Duration
This is a Two Day Course
Course Details
Courses commence at 9:30 a.m. through to 4:30 p.m.
A laptop computer is provided for each delegate attending on this packed programme to try out the tips and techniques demonstrated
All delegates will receive comprehensive Training Courseware to refer to during the course, together with a Course Attendance Certificate
The Excel Power BI Tools
Target Audience
This course is suitable for users who are not familiar with the Power BI Tools and wish to gain an understanding of the features and advantages of the tools available and for users looking to add value to the data they are currently manipulating.
This two day course gives an introduction into the Power BI tools when analysing data from databases, Excel worksheets and other sources. It includes using ‘Dashboards’ to build interactive applications to review the data at the click of a button. In addition to the graphical tools, PowerPivot includes Data Analysis Expressions (DAX) – a new formula language that extends the data manipulation capabilities of Excel – this course gives an introduction to enabling more sophisticated and complex grouping, calculation and analysis with performance enhancements.
The Content
Introduction to Power BI
- What is Power BI?
- The Power BI service
- Power BI Desktop
- Desktop Settings
Data Sources
- Connecting to Files
- Importing Excel Files
- Connect to Server Data (SQL Server)
- Other Data Sources
- Managing Data Relationships
Shaping and Combining Data
- The Query Editor
- Applied Steps
- Advanced Editor
- Shaping Data
- Formatting Data
- Combining Data
- Merging Data
- Join Types
- Transforming Data
- Hierarchies
- Creating Groups
Modelling Data
- What are Relationships?
- Viewing Relationships
- Creating Relationships
- Cardinality
Filter Data
- Visual Level Filters
- Slicers
- Page Level Filters
- Row-Level Security: Roles
- Parameters
- Cross Filter Direction
Interactive Data Visualisations
- Creating Tables
- Creating Charts
- Create Tree Maps
- Create Cards
- Create KPI’s
- Multiple Visualisations Interaction
- Using Geographic Data
- Report Page Layout and Formatting
Working with Calculations
- What is DAX?
- Syntax
- Functions
- Context
- Calculated Columns
- Calculated Tables
- Measures
The Power BI Service
- Reports and Dashboards
- Datasets
- Service Settings
- Dashboard and Report Settings
- Content Packs
- Data Refresh
Delegate Pre-Requisites
Aimed at delegates with a high level of experience using Excel and Pivot Tables combined with an understanding of relational data bases
Course Duration
This is a Two Day Course
Course Details
Courses commence at 9:30 a.m. through to 4:30 p.m.
A laptop computer is provided for each delegate attending on this packed programme to try out the tips and techniques demonstrated
All delegates will receive comprehensive Training Courseware to refer to during the course, together with a Course Attendance Certificate